Due to the really high volatility of the market, it is crucial to have a really good understanding of the market conditions. It is important to note that the forex market is rather fragmented and technical analysis is quite effective here. Technical analysis is the true analysis that is really based on historical data with an emphasis on the price and volume data for the prediction of price in the future. For this reason, the Forex trader in the course of the trade requires to master the ways and means of gathering proper data to make the right decisions. This article will reveal the main instruments and approaches applied in the technical analysis to improve your trading approach.
Understanding Technical Analysis
The primary principle of technical analysis is that price action of the past will be repeated in the future to enable the trader to make correct forecasts. While fundamental analysis relies on the analysis of economic data and market news, technical analysis is completely based on the price and other charts. This makes it possible for the traders to know the trends, reversals and possible entry and exit points in the market.
The base of technical analysis is really embedded in the fact that price contains all the information that is available in the forex market. Hence, through the assessment of price trends and structures, traders can get information on the mood of the market and make respective trades.
Key Tools for Technical Analysis
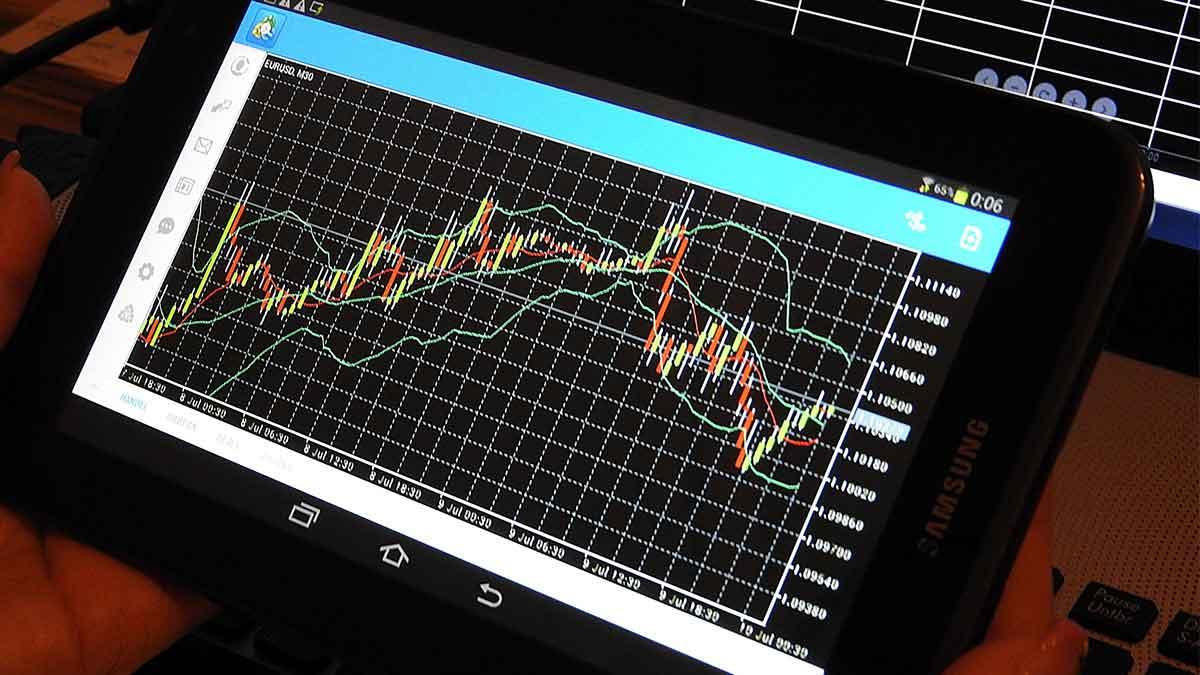
1. Price Charts: Priced charts form the cornerstone of technical analysis. They are graphical illustrations of the price actions of a currency pair over a given time horizon. There are different categories of price charts and these include the line charts, the bar charts and the candlestick charts.
- Line Charts: These are the simplest that are really used to link the closing prices within a specific time duration. While they provide a general picture of the dynamics of the prices, they do not contain information on the price changes in the period.
- Bar Charts: The Bar chart offers more information in that it has the opening, closing, high and low prices for each period. This enables the trader to have a clue of the price fluctuation of the product.
- Candlestick Charts: Out of all the charts that exist in the market, the candlestick charts are by far the most used to see a spread in forex by traders. These are the same as bar charts but with a more presentable design. Every candlestick reflects a certain time during which certain operations were carried out; the body of the candle reflects the difference between the opening price and the closing price of the period and the wicks reflect the highest and lowest prices.
2. Support and Resistance Levels: The levels of support and resistance are some of the terms used in technical analysis. The support is a level in a currency pair at which a lot of buying interest is sawn and thus the price will not continue to fall. Resistance is a level of price at which suppliers are willing to sell larger quantities of goods and hence no more buying pressure can be exerted.
Understanding these levels enables traders to be in a position to know where they can make their entries or exits. For instance, if a particular currency pair is near the support level, the trader may think of purchasing to sell at a higher price. On the same note if the pair is getting closer to a resistance level then it may be safe to neutralize by selling.
Techniques for Applying Technical Analysis
Trend Following: Trend following is a trading strategy where the market trends are identified and the trade is conducted in the direction of the trend. Among the indicators that traders use to identify the direction of the trend are the moving averages and trendlines. That means coming into the trade when the price is ‘going up’ and getting out when the price is ‘going down’ and this is done until the indicators of reversal are picked.
Breakout Trading: Breakout trading is when a trader makes an entry into the market when the price has penetrated a particular level of support or resistance level. This technique is premised on the observation that when a price pierces a particular level it is likely to keep on doing so in the same direction to offer a trade signal.
Mean Reversion: In layman’s language, the mean reversion is a trading strategy that is premised on the fact that price action tends to return to the mean in the long run. This kind of trader seeks to enter the market at conditions that they consider to be overbought or oversold, for instance, by using indicators such as RSI or Bollinger Bands and then they go short or long depending on the current trend with the expectation that price will reversion to the average.
Conclusion
Technical analysis really is one of the most useful tools that Forex traders may use to understand the market and make correct trading decisions. All the tools and techniques described in this article will help you to improve your trading strategy and, therefore, the outcomes in the Forex market.


